Summary:
Spend Agenda is a phrase coined by BusinessOwnersCharter.com for recurring deficit spending. For example a US Fiscal Policy Spend Agenda has deficit spent every year since 2001. Yet according to the International Monetary Fund (“IMF”) on 4/7/22 “Standard economic theory states that inflation will get out of control under a prolonged mix of certain monetary and fiscal policies.” This Report contends that to the degree that a persistent, dominant Spend Agenda recurs is the degree to which inflation may persist. Investment outperformance is a potential solution that may beat inflation.
Fiscal policy and monetary policy both are needed to control inflation. Fiscal policy has been taken over by Spend Agenda politicians. Monetary policy is set by the US Federal Reserve (“the Fed”), who has a legal mandate to reduce inflation to the target rate of 2%. Monetary policy alone cannot control inflation. If a persistent Spend Agenda occurs in a fiat currency, inflation may persist.
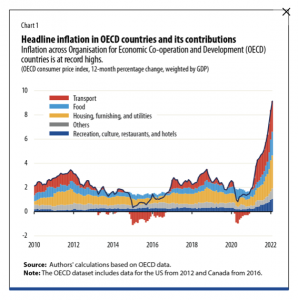
Can you imagine only 5% inflation one year later in April of 2023 given the above Chart 1 from the IMF? The government may claim 5%, but many seem to be spending a lot more money to get the same goods in 2023.
What the IMF can’t address is local inflation. Flowers at Easter time in 2023 in several local Chicago stores doubled in price since the previous year. Many have seen price doubles. Have you seen price doubles in your locality?
According to Bloomberg on 6/12/23: Isabella Weber, an economist at the University of Massachusetts Amherst, argues that much of the US’s recent inflation is “sellers’ inflation,’’ stemming from the ability of dominant firms to exploit their monopolistic position in order to raise prices. Weber notes that “bottlenecks can create temporary monopoly power which can render it safe to hike prices not only to protect but to increase profits.” In June of 2023, a local chain food store had Crispix for $9, and Walmart had it for $5.
Given the nature of inflation in 2023, one who has any potential investing solutions cannot get ahead unless those solutions beat the rate of inflation. Property that is pure scarcity property may beat inflation. The only pure scarcity property sold on an open market exchange is Bitcoin. Including some Bitcoin in a potential investing solution based on your risk tolerance may help to beat inflation.
By reading this Special Report you acknowledge that you will comply with all applicable local, state, national and international laws, rules and regulations; or you will not use this Special Report.
The nature of 2023 inflation.
According to CNBC on 3/31/23 former Greek Finance Minister George Papaconstantinou said “We (European Economic Union) learned about the need to have fiscal and monetary policy working together, we learned that you need to be ahead of the markets and not five seconds behind, always, we learned about speed of response and the need for overwhelming response sometimes, so all of this is good.”
This Special Report contends that fiat currency unlimited supply potential is a root cause of 2023 inflation. All major asset classes have been inflated by the Spend Agenda. There is a current collapse potential for all major asset classes correlated to major sovereign fiat currency.
In comparison, scarcity is all Bitcoin has to offer, an asset class up over 60% year to date as of 6/1/23. This means: if you want inflation protection in your portfolio include some Bitcoin. A small accumulation strategy under 2% may minimize the initial risk of adding Bitcoin to a portfolio.
The Spend Agenda is the major problem.
Worldwide, fiat currency keeps artificially stimulating the world economy through its Spend Agenda fiscal policy, while monetary policy attempts to slow down the economy to reduce inflation.
The two should work together.
Fiscal policy Spend Agenda and monetary policy increasing interest rates are opposing forces. As long as politicians can spend more and more without restraint of their Spend Agenda, artificial economic stimulation may perpetuate inflation.
We believe that it is true that seconds count in a crisis. We disagree that fiat currency can recover from its history of US deficit spending since 2001. The Spend Agenda cannot be overcome in seconds. We contend that any crisis that requires seconds is a signature of instability.
We agree with George Papaconstantinou’s succinct statement of the worldwide banking problem today:
“We are in an environment where interest rates are rising, therefore bond prices are falling, and therefore it is quite likely that banks find themselves with a hole, because they have invested in longer term instruments, and that is a problem,” he said.
The 3/31/2023 CNBC article continues by citing Pimco, a fixed income authority:
Unenviably, central banks must fight a “two-front war” and simultaneously combat high inflation and instability in the financial sector… (said) Gene Frieda, executive vice president and global strategist at Pimco… “it will bring a recession forward. It’s not the end of the world, but it’s certainly not discounted in the equity market,” Frieda told CNBC on 3/31/23.
Bringing recession forward to combat inflation.
Our BOC proprietary statistical research indicates that in 3 out of 4 US historic periods when interest rates were rising to combat inflation, a stock market decline occurred.
The US Presidential election will occur in November of 2024, slightly more than 12 months from this publication (6/6/23). The Chairman of the Fed is appointed by the President. The norm is for the Fed to provide a good economic environment for incumbent politicians seeking office in the 12 months before election. Politicians need to get re-elected in 12 months. The next 12 months may be too risky for a recession before election.
The temptation of artificial stimulation that we call the Spend Agenda is strong, and this deficit spending has occurred every year since 2001. Politicians have a self-interest in getting elected, but few exhibit a profile in courage to reduce the Spend Agenda. Weighed in the balance is the fate of fiat currency.
Without scarcity fiat currency faces credit risk.
Spend Agenda creates fiat currency credit risk. Printing currency is no answer.
Spend Agenda perpetuated inflation has already led to fiat currency credit risk.
The credit risk of any fiat money system is imminent to the degree that funds are drained from its regulatory controlled banks. According to Bloomberg on 3/16/23 “New Fed Bank Backstop Has Scope to Inject as Much as $2 Trillion.” To stem fiat currency credit risk, the Fed had to step in.
US Treasury debt offerings are required to finance the Spend Agenda and to continuously refinance the National Debt. Until the Fed interest rate hiking cycle ends, there is no market for long-dated treasuries, with durations at 5 years or longer, except the Fed. Only the Fed can conceivably hold these long-dated securities to maturity, since their discounted value would cause any other entity holding them to be considered insolvent.
Interest rates and price of debt are inversely correlated. “Held to maturity” accounting preserves the price value of a long-dated treasury debt offering. “Mark to market” accounting creates an immediate loss to the price value of long-dated treasury debt offerings as interest rates rise since those long-dated treasury debit offerings would be sold at a deep discount in the open market today. That is called disintermediation risk.
Disintermediation risk occurs when interest rates rise quickly. In the past year, according to the Wall Street Journal on 6/1/23, the prime rate has risen from 3.25% to 8.25%. Price stability of long-dated treasuries is lacking.
In wide-scale disintermediation risk, there is only one buyer of long-dated treasuries, namely the Central Bank for that money system which is the Fed.
Another risk is liquidity risk. A liquidity risk in treasury debt offerings has already been reported. According to Bloomberg on 5/19/23 Wall Street Fears $1 Trillion Aftershock From Debt Deal. “Treasury will need to scramble to replenish its dwindling cash buffer to maintain its ability to pay its obligations, through a deluge of Treasury-bill sales. Estimated at well over $1 trillion by the end of the third quarter, the supply burst would quickly drain liquidity from the banking sector, raise short-term funding rates and tighten the screws on the US economy just as it’s on the cusp of recession.”
The Fed alone can afford to hold to maturity the unwanted long-dated treasuries which may cause a liquidity drain worldwide. Brokerage firms, world currency reserves and all others holding long-dated treasuries may face the same disintermediation risk.
A selective opportunity for equities may exist.
If the Fed does not significantly further raise interest rates before the election cycle, a selective opportunity for equities may exist. Yet possibly not enough to beat inflation currently at 5%.
A global upheaval may be underway.
In a prescient Barron’s interview 12/8/22 according to Felix Zulauf “A global upheaval is under way, with major challenges ahead for the world economy, inflation, the dollar, and more.”
For example in a 60/40 stock and bond portfolio, the bond price falls as interest rates rise. Until the Fed rate hiking cycle ends the long-term maturity >4 months sovereign bond market is soft while the short-term maturity < 4 months sovereign bonds market is a crowded trade. The financial mechanics are predictable. Higher interest rates negatively affect bond prices.
So, the problem is not only entity disintermediation risk, but also underlying credit risk of the world’s reserve currency which is the US Dollar. Other central banks have a disintermediation risk by holding long-dated Treasuries.
Counterintuitively, being in ultra short-term corporate debt yields about 5% as of 6/1/23. Having an effective duration of about 5 months may sidestep the long-duration disintermediation risks facing US Treasury-based money market funds. Low corporate credit risk may beat US Treasury money market funds credit risk in periods of high entity disintermediation.
Money System Collapse Potential
In summary of the above, the US fiat currency problem is this. Banks lock up Treasuries under “Held to Maturity” accounting rules to avoid “Mark to Market” losses, which reduces liquidity, leaving the Fed alone to backstop Treasury market liquidity. If the money isn’t there, the only option may be for the Fed to print more currency. To the degree that the world does not accept the Fed printing more currency, may be the degree to which the worldwide money system collapse potential exists.
- “At a precarious moment, the world is awash in sovereign debt,” said the Minneapolis Fed 11/10/22. “High debt and rising rates can restrict economic policy of developed economies and drive low-income countries into default with no clear safety net,” they said.
- Having a backdoor capability to transact in Bitcoin could offer potential protection from a money system collapse.
- Initial Spend Agenda protection may come from a minimal amount being in Bitcoin, digital currency market leader, installing individual capability, not as an investment, but only as a capability.
After a money system collapse, ultimately stocks may be the best place to be. Corporations seemingly would figure it out.
Inflated Assets
The Spend Agenda is popular among politicians because it may be executed without taxation by printing currency and provide a wealth effect. The “wealth effect” is the notion that when households become richer as a result of a rise in asset values, they spend more and stimulate the broader economy.
The Spend Agenda
BOC coined the phrase Spend Agenda to depict a lack of balance in Monetary Policy and Fiscal Policy combined. Monetary policy refers to the actions of the Fed to achieve macroeconomic policy objectives such as price stability, full employment, and stable economic growth. Fiscal policy refers to the tax and spending policies of the federal government.
The Spend Agenda lack of balance 22-year excess may be seen in Fiscal Policy of deficit spending every year through the date of this report. In 2008, another unhealthy curve in the road began with Quantitative Easing or printing currency to fuel the Politicians’ ever increasing Spend Agenda. Such combined Spend Agenda policy was as excessive as the wealth effect it produced:
- The Spend Agenda rests on the false assumption that there is no upper limit to printed currency. At current levels of US National Debt, the only way that our currency may remain afloat may be by printing more currency since that is what has been done in the past.
- In the Spend Agenda Era whichever party is in office that party carries out its own Spend Agenda.
- Printing currency and increasing US National Debt in reality has falsely passed as a substitute for pay as you go taxation.
- Most amazingly, politicians avoid the ire of taxpayers being charged a tax bill by printing currency, growing the US National debt and creating a wealth effect.
- All major asset classes have been super inflated by the Spend Agenda since 2001. Now the cycle may be in reverse while a true recession has not yet hit the world economy.
- We have already seen cracks in the money system as the Fed shores up banks with disintermediation risks and their depositors.
Ten Year Period Ending March 2023
In a ten year period from March of 2013 thru March of 2023, we see the inflated values starting to fall self evidentially correlated to all major asset classes: including real estate, stocks, bonds, and the fiat currency itself, namely the US Dollar.
- -8% Residential Real Estate – Up 92% at 10-year peak to down -8% on 3/3/23. According to the com, over the ten years ended March 2023, the median home price beginning in March 2013 was $257,500, peaking in October of 2022 at $496,800 up 92% (496,800/257500-1=92%); and in March 2023 was $455,800 (1-455,800/496,800= down 8%. Why? According to FreddieMac The U.S. weekly 30-year mortgage rate average as of 3/3/22 was 3.76%, compared 3/2/23 of 6.65% When current renters try to buy, their monthly payments increase 38%.
- -23% Commercial Publicly Held Real Estate – Up 65% at 10-year peak to down -23% on 3/3/23. Real Estate Investment Trusts, according MSCI U.S. REIT Index, over the ten years ended 3/3/23, the REIT price 3/4/13 was about 957, peaking 12/31/21 at about 1578 up 65% (1578/957-1=65%); and on 3/3/2023 was about 1222 (1-1222/1578=-23%) down 23%. Why? REITS are affected by high mortgage rates, and Covid related low office occupancy.
- -24% Bonds – Up 2% at 10-year peak to down -24% on 3/3/23. According to TCW Total Return Bond Fund (symbol TGLMX) over the ten years ended 3/3/23, the TGLMX price on 3/4/13 was about 10.3, peaking about 8/6/21 at about 10.6 up about 3% (10.6/10.3-1=3%); and on 3/3/2023 was about 8.1 (1-8.1/10.6=-24%) down about 24%. Why? In the run-up to the Peak as interest rates fell, bond prices rose. Now with the Fed hiking interest rates to battle inflation, bond prices fall in value. The market price of a bond is lowered to compensate for higher interest rates, leaving Total Returns underwater.
- -39% Commodities – Up 6% at 10-year peak to a recent drop of -39% on 3/3/23. According to the GSCI Commodity Index (symbol GSG) over the ten years ended 3/3/23, the GSG price 3/4/13 was about 32.22, peaking about 6/20/14 at about 34.31 up about 7% (34.31/32.22-1=7%); and on 3/3/23 was about 20.87 (1-20.87/34.31=-39%) down about 39%. Why? According to Worldbank in 2015 “A five-year-long slide in most commodity prices continued… Both ample supplies and weak demand, especially for industrial commodities, contributed. Price weakness is expected to persist.” In 2020 commodities rebounded from their Covid low of 7.93 on 4/28/20 to a recent high of 26.34 on 6/8/22, before falling again to about 20.87 on 3/3/23, a recent drop of -21% (1-20.87/26.34=-21%).
- -15% Stocks – Up 217% at 10-year peak to a recent drop of -15% on 3/3/23. According to the S&P 500 etf (Symbol SPY) over the ten years ended 3/3/23, the SPY price 3/4/13 was about 152.92, peaking about 1/4/22 at about 477.55 up about 217% (477.55/152.92-1=213%); and on 3/3/23 was about 404.19 (1-404.19/477.55=-15%) down about 15%. Why? According to CNBC on 12/29/22 “Sticky inflation and aggressive rate hikes from the Federal Reserve battered growth and technology stocks and weighed on investor sentiment… Geopolitical concerns and volatile economic data also kept markets on edge.” And overvaluation. A stock’s price to earnings ratio (“P/E”) is a measure of value. The higher the P/E the lower the value. According to com the 1-year trailing P/E ratio of the S&P 500 on 1/1/23 was estimated at 22.97. According to BOC fundamental value research Appendix A the average P/E over a 40-year period commencing 1/1/82 thru 11/30/22 is 22, and the average P/E over 150 years according to Multpl.com is 16.
- US Fiat Currency: The amount of money in circulation grew by a factor of 21. National Debt grew by a factor of 1.8. Printed currency grew by a factor of 1.7.
According to the St. Louis Federal Reserve:
- In March 2013 the US Dollar Fiat Currency in circulation was about 1 trillion, the national debt was about 17 trillion, and printed currency on the fed balance sheet was about 3 trillion (MBS+Treas) a total of 21 trillion.
- In March 2023 the US Dollar Fiat Currency in circulation was about 21 trillion, the national debt was about 31 trillion, and printed currency on the fed balance sheet was about 8 trillion (MBS+Treas) a total of 60 trillion.
Therefore, the amount of money in circulation grew by a factor of 21 (21/1=21).
National debt grew by a factor of 1.8 (31/17=1.8).
Printed currency grew by a factor of 2.7 (8/3=2.7).
The Spend Agenda got a boost from the Fed.
According to the Fed on March 15, 2020 the Fed eliminated bank reserve requirements. The Fed allowed banks to lend all deposits without holding back some in reserves. This dramatically increased the amount of money in circulation.
A combined effect of the Spend Agenda and Fed boost was inflated assets across the board in the last decade, with no end in sight in the next decade. According to Bloomberg on 5/29/23: “The debt-limit deal… barely dents the roughly $20 trillion in combined budget deficits projected over the next decade.”
Why are all major asset classes down? Because the cost of leverage is up. Leverage is the magnification of the impact of earnings due to debt. As the cost of debt rises, demand for debt decreases. Like any other commodity, the cost of debt is subject to free market laws of supply and demand. Inflation is an outcome of the Spend Agenda. The Spend Agenda puts our money system at risk. There is an upper limit to the amount of US Dollar money system to deficit spend. A true measure of deficit spending is the ratio of National Debt to currency in circulation. The Money Model projects the ratio trend. An upper limit to the ratio occurs at the end of the trend, namely National Debt to currency in circulation of over 10x (1062%).
The root cause of the correlation of a collapse potential for all major asset classes rests in the Spend Agenda. All major sovereign nations have their own Spend Agenda. The collapse potential is worldwide. Being nimble is what Oscar Zulauf suggests for the next decade of global upheaval. When the collapse is complete seemingly corporations will find a way to figure it out. Then a period of unheralded momentum and value may occur again in stocks.
The global upheaval may occur in chunks.
A chunk such as the stock market may fall. Then rise again. A context principally from the stock market may opportunistically provide a Market Exit Strategy.
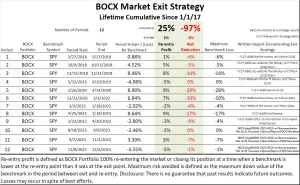
Re-entry profit is defined as a portfolio 100% re-entering the market or closing its position at a time when a benchmark is lower at the re-entry point than it was at the exit point. Maximum risk avoided is defined as the maximum down value of the benchmark in the period between exit and re-entry. For example BOC has a Market Exit Strategy.
Conclusion
The only way that the Spend Agenda can increase the wealth effect is by borrowing more. If a persistent Spend Agenda occurs in a fiat currency, inflation may persist. If the Fed does not further raise interest rates significantly before the election cycle, a selective opportunity for equities may exist. Yet possibly not enough to beat inflation at 5%. According to S&P Dow Jones Indices, fewer than 13% of funds beat the S&P 500 (etf symbol SPY). Outperformance is a potential investment solution that may beat inflation.
End of Special Report
Newsletter
Our market exit strategy employs a published special report available to subscribers costing $1,000 per year mitigating risk in down markets. The macro analysis is the context. Actual model portfolios are included in our Newsletter.
For example, a 2008 Special Report thesis stated: “With respect to the 2008 bailout) the money to fund $1.4 tn (trillion) dollars won’t be there, much less $9 tn to $16 tn dollars. If the money isn’t there and the government still wants its stimulus, the government has no choice except to print currency.”
And as predicted the money really wasn’t there. Printing fiat currency to fund the bailout was present, and was given the name Quantitative Easing.